BayDeltaLive.com Help Guide *Under Construction*
Live Conditions: Real Time Data
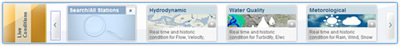
LIVE CONDITIONS allows user to access real time station data from CDEC and USGS NWIS using a map and analyze this data using BDL graphing applications and data visualization tools. To view live station data, simply choose from the sub navigation the format you wish to review: Data Category, Station List, Data Presets or Favorite Stations.
By Category
How to select a sensor and graph time series data
Live Conditions data is currently streaming from a variety of sources. CDEC (DWR California Data Exchange Center) provides much of the real time data for Baydeltalive.com. For more information on CDEC, please visit www.cdec.water.ca.gov
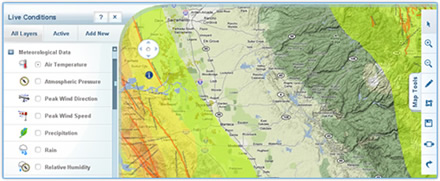
Procedure: Click on the Live Conditions tab to load this section. In the SubNav a number of category options are loaded.
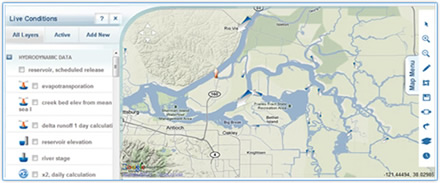
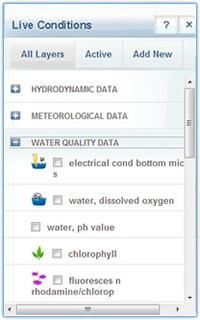
Real-Time data has been categorized for quick access to the data. Categories include: Hydrodynamic, Water Quality, Meteorological, Presets (groups of stations), and your Favorite Stations (available when logged in).
To the left is the Live Conditions Layer Manager. Here you can access all sensors via the drop down menu. Once selected, the sensors within the map extents or map view will load onto the map. A Timeline is provided to access a specific date range. The time series is defaulted to the last 12 hours.

To view the latest sensor reading, rollover the sensor icon or click on the sensor to get the rollover to stick open.
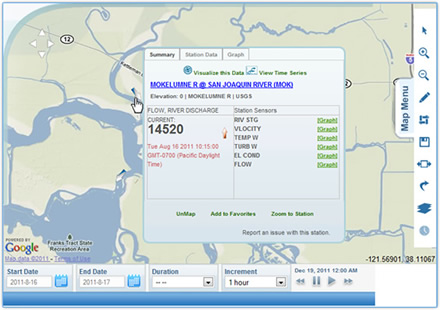
The current value is on the left. If you would like to view, overlay, or compare this time series with other data or just view this time series, click on the [Graph] button to load the USGS Gr Graphing Application. ***NOTE: Java 6 required.
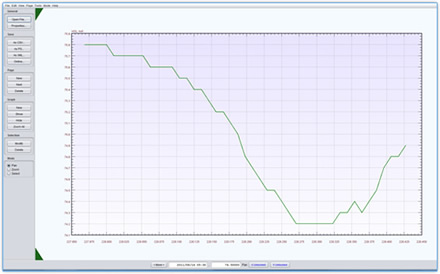
Please click on the ling to view and download the User Manual for USGS Gr Graphing Application. http://pubs.usgs.gov/of/2009/1181/ofr_2009-1181.pdf